Deploy metrics-server, validate with kubectl top (§4.2, §4.3).
Install Prometheus + Grafana; dashboard for cluster CPU/memory.
Instrument an app with a /metrics endpoint; configure Prometheus to scrape it.
Debug a failing Pod with kubectl logs; forward logs to Fluent Bit, view in Kibana or Grafana Explore.
Alertmanager rules (e.g. node memory pressure, Pod CrashLoopBackOff) + test notification routing.
[!NOTE]
Beyond the course: CKA scope here is only metrics-server + kubectl top, and kubectl logs/node-level logs. Prometheus, Grafana, EFK, Loki and Alertmanager are not exam tasks. Node/control-plane log locations for troubleshooting:
journalctl -u kubelet -f # kubelet runs as a systemd service (not a Pod)kubectl logs -n kube-system kube-apiserver-controlplane # static-Pod control-plane componentscrictl ps -a; crictl logs <container-id> # when the API server is downls /var/log/pods /var/log/containers # raw container log files on the node
Polls each node's kubelet (which embeds cAdvisor — container Advisor — exposing node + container stats via the Summary API).
Aggregates in memory and serves via the Kubernetes Metrics API → used by kubectl top and HPA.
No disk persistence, no history → for historical data/advanced queries use Prometheus or another TSDB.
Diagram (new): kubelet/cAdvisor stats on every node are scraped by metrics-server and exposed through the API server's Metrics API to kubectl top and HPA. API path, port and scrape interval are beyond-course details.
[!NOTE]
Beyond the course: the Metrics API is metrics.k8s.io/v1beta1, registered with the API server's aggregation layer via an APIService object (kubectl get apiservice v1beta1.metrics.k8s.io → AVAILABLE=True when healthy). Current metrics-server (v0.6+) scrapes the kubelet's /metrics/resource endpoint on port 10250 (older versions used /stats/summary); default --metric-resolution=15s. You can query raw: kubectl get --raw /apis/metrics.k8s.io/v1beta1/nodes.
Give it a short time after deployment before metrics appear.
[!CAUTION]
Correction: the deploy/1.8+/ directory no longer exists in the upstream repo (the course itself says the path may change). Current upstream install:
Installs into kube-system. On lab/kubeadm clusters with self-signed kubelet certs, the Pod may stay not-ready with x509 errors until you add --kubelet-insecure-tls to the container args (lab/dev only).
[!CAUTION]
Correction: the course shows kubectl top pods output with CPU%/MEMORY% columns. Real output for Pods has only NAME CPU(cores) MEMORY(bytes) (percentages exist only for nodes, relative to allocatable) — as seen in the lab output in §4.3.
[!NOTE]
Beyond the course — exam-useful flags:
kubectl top pod -A --sort-by=memory # or --sort-by=cpu; highest firstkubectl top pod <pod> --containers # per-container usagekubectl top pod -l app=web -n prod # filter by label/namespacekubectl top node --sort-by=cpu --no-headers | head -1 # busiest node, scriptable
No data / error: Metrics API not available → check Metrics Server Pods are running and read their logs (kubectl -n kube-system get pods, kubectl logs ...).
Kubelet Summary API must be reachable from Metrics Server — network policies, firewalls, or RBAC can block it.
Need history? Metrics Server has none → Prometheus/TSDB.
Lab manifests are modified/insecure — not for production
3
Wait
retry kubectl top after 1–2 min
Errors right after install are normal
4
Node with most CPU
kubectl top nodes → controlplane (470m)
Control-plane components run there
5
Node with most memory
kubectl top nodes → controlplane (1252Mi)
—
6
Pod with most memory
kubectl top pods → rabbit (252Mi)
—
7
Pod with least CPU
kubectl top pods → lion (1m)
—
git clone https://github.com/kodekloudhub/kubernetes-metrics-server.gitcd kubernetes-metrics-serverkubectl create -f . # creates every manifest in the directory# Lab output:# namespace/metrics-server created# serviceaccount/metrics-server created# clusterrole.rbac.authorization.k8s.io/system:metrics-server created# clusterrolebinding.rbac.authorization.k8s.io/system:metrics-server created# service/metrics-server created# deployment.apps/metrics-server created
Lab repo files (README: development/learning only, insecure, not for production): aggregated-metrics-reader.yaml, auth-delegator.yaml, auth-reader.yaml, metrics-apiservice.yaml, metrics-server-deployment.yaml, metrics-server-service.yaml, resource-reader.yaml. For production follow the official repo kubernetes-sigs/metrics-server.
[!TIP]
Answer "most/least" questions without eyeballing: kubectl top pod --sort-by=memory (highest first) or kubectl top node --sort-by=cpu. (--sort-by is beyond the course.)
Containerised apps should log to stdout / stderr; the container runtime captures the streams and CLI tools expose them. Same rule in Kubernetes: kubelet (via the runtime) captures them → kubectl logs.
Diagram (new): runtime writes container stdout/stderr to files on the node; kubectl logs goes API server → kubelet → file; node log agents tail the same files. File paths and the API path are beyond-course details.
Course lab: omitting -c produced an error asking for a container.
[!CAUTION]
Correction: current kubectl logs uses the kubectl.kubernetes.io/default-container annotation, or the first container, when -c is omitted. It may print Defaulted container ... out of: ...; pass -c explicitly to avoid reading the wrong logs. See default-container.
docker logs / kubectl logs suffice for dev and basic troubleshooting.
Production: cluster-wide collectors/aggregators (Fluentd / Fluent Bit → Elasticsearch + Kibana, or hosted SaaS) to collect, index, retain, search and alert centrally.
Next steps: structured (JSON) logging, sidecar log processors, Fluentd/Fluent Bit shipping.
[!NOTE]
Beyond the course: dockershim was removed in v1.24 — on cluster nodes use crictl logs <container-id> (find IDs with crictl ps -a), not docker logs. Other kubectl logs flags worth knowing:
kubectl logs <pod> -p # --previous: logs of the crashed/restarted container instancekubectl logs <pod> --all-containers # every container (incl. init) in the Podkubectl logs <pod> --tail=50 --since=1h # last 50 lines / last hourkubectl logs <pod> --timestampskubectl logs deploy/<name> # picks one Pod of the Deploymentkubectl logs -l app=web --all-containers # by label selectorkubectl logs <pod> -c <init-container> # init containers too
Logs live on the node and are lost when the Pod is deleted (kubelet rotates them, default 10Mi × 5 files).
[!WARNING]
Exam traps / remember:
Multi-container Pod: always select -c <name>; current kubectl can default to a different container than intended.
CrashLoopBackOff: current logs may be empty — use kubectl logs -p.
Task "save logs to a file": kubectl logs <pod> -c <ctr> > /path/file (run on the host the task specifies).
Why can't USER5 log in? (webapp-1, single container)
kubectl logs webapp-1
Repeated WARNING ... USER5 Failed to Login as the account is locked due to MANY FAILED ATTEMPTS. → account locked; fix by unlocking/resetting credentials
3
Logs of webapp-2
kubectl logs webapp-2
Course output: error: a container name must be specified for pod webapp-2, choose one of: [simple-webapp db]; current kubectl defaults to the annotated/first container (§4.4).
4
Web app logs in webapp-2
kubectl logs webapp-2 -c simple-webapp
—
5
Which user's purchase failed?
read simple-webapp logs
Two warning patterns: USER5 locked out (login) and USER30 Order failed as the item is OUT OF STOCK. → purchase issue = USER30, item out of stock
Sample log line format: [2022-04-16 19:55:58,923] WARNING in event-simulator: USER7 Order failed as the item is OUT OF STOCK. (first Pod also shows USER7 out-of-stock warnings).
kubectl get pod <pod> -o jsonpath='{.spec.containers[*].name}' # list container nameskubectl describe pod <pod> # also lists containerskubectl logs <pod> -c <container> # pick a containerkubectl logs <pod> | grep USER5 # filter by user/keywordkubectl logs <pod> -c simple-webapp | grep -i warning # only warnings
Check Pod status first; specify -c for multi-container Pods.
Scan for repeated WARNING/ERROR lines and correlate timestamps with the reported incident.
[!TIP]
The Defaulted container ... out of: ... line (or older error) lists container names. Still select -c explicitly. Use grep on user IDs/keywords instead of scrolling.

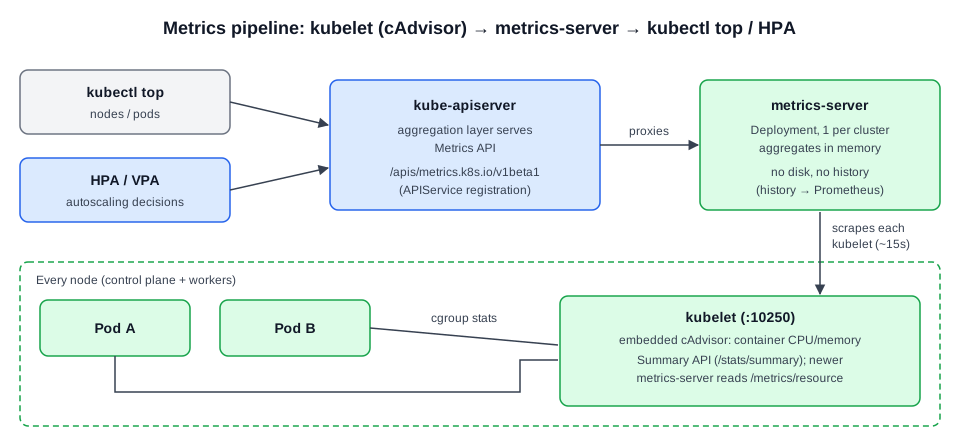 Diagram (new): kubelet/cAdvisor stats on every node are scraped by metrics-server and exposed through the API server's Metrics API to
 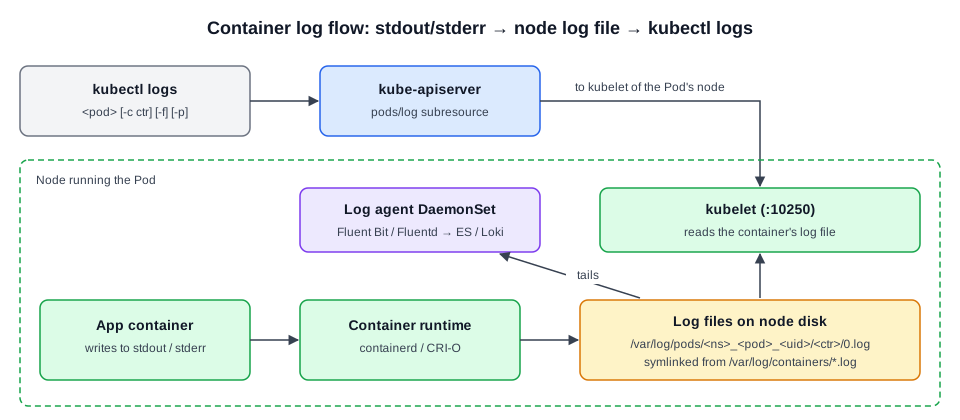 Diagram (new): runtime writes container stdout/stderr to files on the node;